In today’s data-driven world, businesses and organizations are constantly seeking ways to gain insights from their events and improve their strategies. One powerful tool for achieving this is regression analysis, which can provide valuable insights by examining the relationship between variables and predicting future outcomes. With its user-friendly interface and built-in statistical functions, Excel offers a convenient platform for conducting regression analysis. In this comprehensive guide, we will delve into the intricacies of regression statistics in Excel, covering everything from basic concepts to advanced techniques.
Introduction to Regression Statistics in Post-Event Analysis
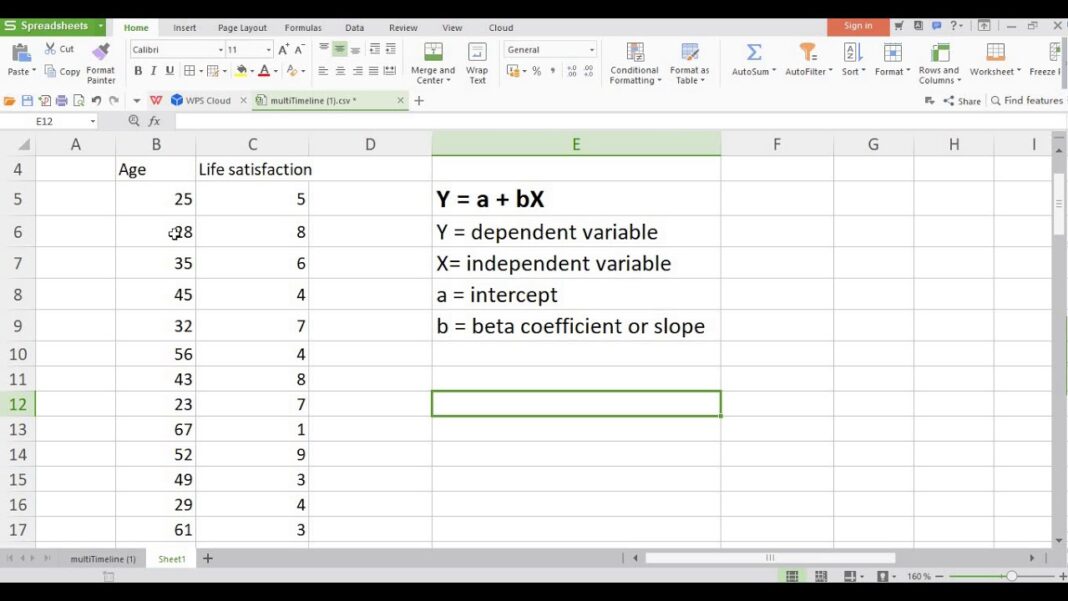
Regression analysis is a statistical technique that aims to establish a mathematical equation that describes the relationship between a dependent variable (the outcome you’re trying to predict) and one or more independent variables (the factors influencing the outcome). It is widely used in various fields such as business, finance, healthcare, and social sciences for analyzing and predicting trends and patterns.
Post-event analysis is a critical process that involves evaluating the performance and impact of an event after its occurrence. By using regression statistics in post-event analysis, organizations can gain valuable insights into the effectiveness of their strategies and make data-driven decisions for future events. Now, let’s dive into the steps of performing regression analysis in Excel for post-event analysis.
Setting Up Your Excel Spreadsheet for Regression Analysis

Before we jump into performing regression analysis, it’s essential to set up our Excel spreadsheet correctly. A well-organized and structured spreadsheet will save time and effort in the long run. Here are some tips for setting up your Excel spreadsheet for regression analysis:
- Use columns for each variable: Each independent variable should have its own column, and the dependent variable should be in a separate column.
- Label your data: Assign appropriate labels to each column to make it easier to identify the variables.
- Keep the data clean: Remove any unnecessary rows or columns, and ensure that there are no blank cells in your data.
- Use separate sheets for different events: If you are analyzing multiple events, it’s best to use separate sheets for each event to keep the data organized.
Inputting and Organizing Event Data in Excel

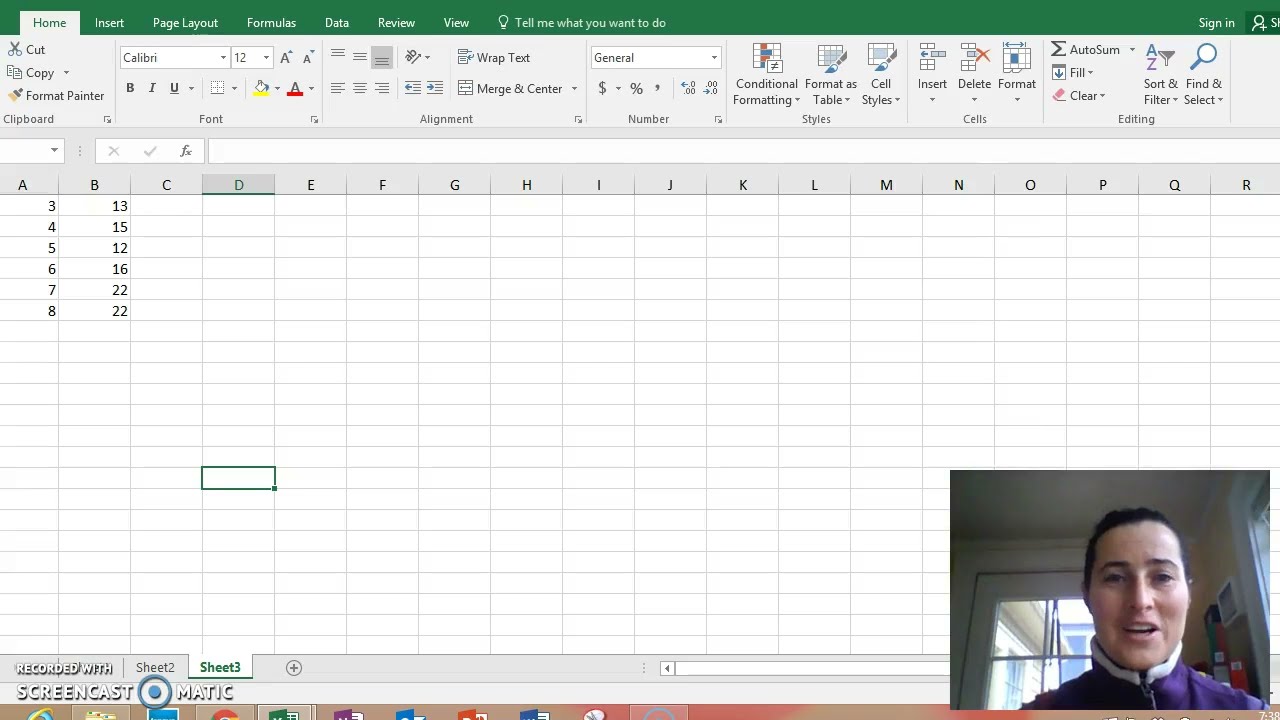
Once we have our spreadsheet set up, we can start inputting our event data into Excel. The first step is to organize the data based on the variables we want to analyze. For example, if we want to examine the relationship between attendance and revenue for an event, we would input the number of attendees in one column and the revenue generated in another. Once the data is entered, we can begin performing regression analysis.
Performing Regression Analysis in Excel: Step-by-Step Guide
Here’s a step-by-step guide for conducting regression analysis in Excel:
Step 1: Selecting the Data
The first step is to select the data we want to analyze. This can be done by highlighting the cells containing the data or by using the “Table” feature in Excel.
Step 2: Inserting Scatter Plot
Next, we need to insert a scatter plot, which will create a visual representation of the relationship between the variables. To do this, go to the “Insert” tab and click on “Scatter.” From the dropdown menu, select the desired scatter plot type.
Step 3: Adding Trendline
After creating the scatter plot, we can add a trendline to see the line of best fit. Right-click on any data point on the scatter plot and select “Add Trendline.” A new window will appear where we can customize the trendline’s appearance and choose the type of regression model we want to use.
Step 4: Calculating Regression Statistics
By selecting the “Options” tab in the trendline window, we can display the regression equation and R-squared value on the chart. The regression equation represents the line of best fit, and the R-squared value indicates how well the data fits the line. A higher R-squared value indicates a stronger relationship between the variables.
Step 5: Interpreting the Results
Once the regression analysis is performed, we can interpret the results to gain insights into our event. If the R-squared value is close to 1, it indicates a strong correlation between the variables, meaning that changes in one variable significantly affect the other. On the other hand, an R-squared value close to 0 suggests a weak relationship between the variables.
Interpreting Regression Analysis Results for Event Insights
Now that we have performed regression analysis on our event data, let’s look at some practical ways to interpret the results and gain insights for future events.
- Determine the most influential variables: By looking at the coefficients in the regression equation, we can determine which independent variable has the most significant impact on the dependent variable. This can help us focus on the key areas for improvement in our future events.
- Identify trends and patterns: The scatter plot and trendline can help us identify any trends or patterns in the data. For example, we might notice that as ticket prices increase, attendance decreases, indicating a need to find a balance between pricing and attendance.
- Predict future outcomes: Regression analysis can also provide predictions for future events by using the established regression equation. This can aid in making data-driven decisions for event planning and budgeting.
- Compare different events: By conducting regression analysis on multiple events, we can compare the relationships between variables and identify any similarities or differences. This can help us improve our overall event strategies and make informed decisions.
Practical Applications and Case Studies of Post-Event Analysis
Regression analysis has numerous practical applications in post-event analysis. Here are some real-life examples of how organizations have used regression statistics in Excel to gain valuable insights from their events:
- Predicting attendance for music festivals: A music festival organizer used regression analysis to predict attendance for future events based on factors such as ticket price, lineup, and weather conditions. This helped them make data-driven decisions for event planning and marketing.
- Analyzing the impact of marketing campaigns: A company organizing trade shows used regression analysis to determine the effectiveness of their different marketing campaigns on event attendance. By analyzing the relationship between marketing efforts and attendance, they were able to allocate resources more efficiently in the future.
- Evaluating the ROI of sponsorship deals: A sports team used regression analysis to determine the ROI of their sponsorship deals by examining the relationship between brand exposure and ticket sales. This helped them negotiate better deals with sponsors and maximize their revenue.
- Planning future events: A conference organizer used regression analysis to identify the key elements that contribute to the success of their events, such as speakers, topics, and location. This helped them make informed decisions for planning future events and improve attendee satisfaction.
Conclusion
In conclusion, mastering regression statistics in Excel can greatly benefit organizations in gaining insights from their post-event analysis. By understanding the basics of regression analysis, setting up our spreadsheet correctly, and interpreting the results effectively, we can make data-driven decisions for future events and improve our overall strategies. With its user-friendly interface and built-in statistical functions, Excel is an excellent tool for conducting regression analysis and gaining valuable insights. So next time you’re analyzing your event data, remember to incorporate regression statistics in Excel for a comprehensive and in-depth understanding of your event’s performance.

